Hacker Perspective: Proof of Global Warming
Introduction
In this controversy, scientific evidence falls into two categories:
- Direct measurements (which began with the invention and sale of inexpensive accurate thermometers in the mid 1860s) require little interpretation provided you understand a small amount of science.
- Proxy measurements require quite a bit of interpretation (because they cross many scientific disciplines -and- are spotty so do not necessarily represent worldwide events) and so should only be left to the experts in the court of 'peer reviewed' science.
- Indirect measurements via weather satellites.This catches many non-experts off guard, because it is not possibles to build a thermometer,
launch it into space, then just point it down to measure temperature. In fact, most weather satellites measure temperature by first measuring radio waves emitted by
oxygen atoms, which are then run though more than a dozen mathematical steps to "infer" the atmospheric temperature. Much of this work was done by numerous
organizations including these two:
- UHA (University Huntsville Alabama
- RSS (Remote Sensing Systems)
Proof 1: Sea Level Rise

- Since the economies of seafaring nations where tied to ocean-based commerce, their respective navies began collecting oceanic statistics which included the rise and
fall of tides by the use of "tide gauges". An unexpected observation was that sea levels were (on average) always rising over time.
- The earliest European measurements began in 1675 Holland. Britain followed soon after.
- Measurements for the 134 years between 1870 and 2004 indicated a rise of 19.5 cm (7.67 inches) which can be averaged to 1.45 mm per year
- https://en.wikipedia.org/wiki/Sea_level_rise#Tide_gauges
- Western countries have been launching weather satellites with down-looking RADAR starting in the early 1990s
- Measurements between 1992 and 2002 (10 years) set average annual sea level rise to 3.4 mm (13.3 inches per century)
- Measurements between 1992 and 2022 (30 years) set average annual sea level rise to 3.9 mm (15.3 inches per century)
- Measurements between 2013 and 2022 (9 years) set average annual sea level rise to 4.62 mm (18.2 inches per century)
- https://en.wikipedia.org/wiki/Sea_level_rise#Satellites
- https://earthobservatory.nasa.gov/images/150192/tracking-30-years-of-sea-level-rise
- Comments:
- In mathematics, averages are good in that they can hide/reduce unexpected blips. They are bad in that they can hide acceleration so you must compare successive averages.
- In physics:
- "Distance over time" is labelled velocity.
- An increasing velocity is known as acceleration.
- Since the rate-of-rise (velocity) is increasing then it can be said that sea level rise is accelerating (way worse than just saying it is rising)
- Ignoring acceleration for a moment, let's assume a steady velocity of 4.62 mm per year. Simple math shows that the absolute minimum rise over the next 100 years will be 462 mm (46.2 cm or 18.3 inches) higher than now.
- Note that sea level is measured vertically. Since most shore lines and beaches are angled like ramps, "high tides" and "storm surges" will do more damage much sooner.
- The sea level observation alone usually induces rational skeptics to change their point of view into the direction of concern.
https://en.wikipedia.org/wiki/Scientific_consensus_on_climate_change
Direct Measurements:
- https://en.wikipedia.org/wiki/Sea_level_rise
- https://earthobservatory.nasa.gov/images/150192/tracking-30-years-of-sea-level-rise
- http://sealevel.colorado.edu/
Indirect Measurements:
- Sea level was 120m (393ft) lower during the last ice age 20,000 years ago but has been
rising ever since.
comment: this enabled humans to walk to North America over the Bering Sea land bridge. See: https://en.wikipedia.org/wiki/Settlement_of_the_Americas
Summaries:
- melting glaciers as well as melting polar ice are the primary contributors to level rise
- since warmer water occupies a slightly larger volume then warming also contributes to sea level rise (e.g. the rise will continue after all the ice is melted)
- Earth is still coming out of the ice-age that ended 11,700 years ago so some of this warming/melting is natural. However, unlike the past half-dozen ice-ages, this one happened during a time when the human population exceeded 1 billion which enabled the CO2-releasing industrial age. The current human population now exceeds 8 billion (as of Nov-2022)
Proof 2: The current inter-glacial is different
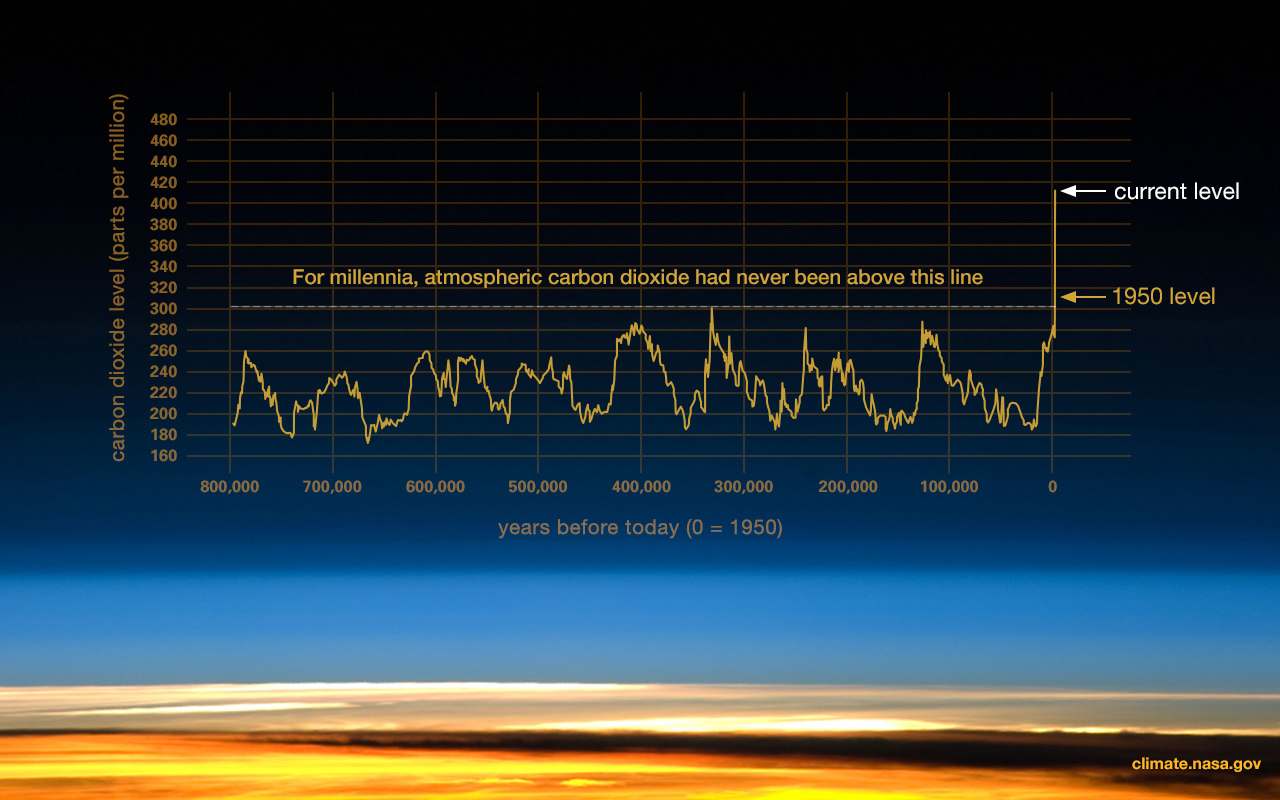
- Homo sapiens, the current human form, have only existed for 200-300 thousand years which means there was no one was present to do direct measurements before than time. This means that indirect (proxy) measurements are all we have available to us.
- What humanity knows about previous glacial periods (ice ages) comes from ice cores extracted in places like Antarctica and Greenland
- While there are no hard-and-fast rules about this stuff, ice ages happen approximately every 120 thousand years when CO2 levels fall below 230 ppm (the chart to the right shows 7.5 such cycles.
- However, this chart as well as others has convinced scientists that the normal variation swings, on average, between 180 ppm and 280 ppm.
- Notice that the current inter-glacial has CO2 numbers more than 140 ppm above 280 ppm.
- The reason for this is that the current inter-glacial has enabled a human population explosion which enabled an industrial revolution
Proof 3: CO2 is rising while Oxygen is falling
- Average global temperatures have risen 1.05 C (1.9 F) degrees since broad measurements began in 1880
Direct Measurement: http://climate.nasa.gov and https://www.giss.nasa.gov/research/ - CO2 levels have risen 27% since annual measurements began in 1958
Direct Measurement: https://gml.noaa.gov/webdata/ccgg/trends/co2_data_mlo.png (most recent CO2 data)
Computed Rate of Increase: ((412-315) / (2019-1958)) = (97 / 61) = 1.59 ppm per year - Oxygen levels have fallen (695-103) = 592 per meg since annual measurements began in 1990
Direct Measurement: http://scrippso2.ucsd.edu/ (data sets are freely available for download )
Analysis:- http://scrippso2.ucsd.edu/faq
quote: These units refer to different types of quantities, so the question needs to be sharpened before it can be clearly answered. Suppose a tree consumes exactly one molecule of CO2 for each O2 molecule produced by photosynthesis. The changes in atmospheric O2 and CO2 near the tree will then be inversely proportional. What is the proportionality factor in per meg/ppm? The answer is 1/.2095 = 4.8 per meg/ppm, where 0.2095 is the O2 mole fraction of air. This can be derived realizing that, because N2 is constant, the relative change in the O2/N2 ratio is the same as the relative change in O2 and calculating the relative change requires dividing by its abundance. - http://ossfoundation.us/projects/environment/global-warming/the-keeling-curves ("O2 Curve" vs. "CO2 Curve")
- https://cdiac.ess-dive.lbl.gov/trends/oxygen/modern_records.html
quote: Oxygen concentrations are currently declining at roughly 19 per meg per year, or about 4 ppm per year. One "per meg" indicates one molecule out of 1,000,000 oxygen molecules, or roughly one molecule in 4.8 million molecules of air. - https://skepticalscience.com/human-fingerprint-in-global-warming.html
- Since O2 production by non-animal life is not able to compensate for all the "unnatural" fossil fuel burning by humanity, it appears that our biosphere is slowly dying.
- Most people forget that our machines (cars, trucks, boats, planes, tanks, etc.) also breathe in oxygen while exhaling carbon dioxide
- http://scrippso2.ucsd.edu/faq
Links
- introduction to climate science
- introduction to climate modeling
- https://en.wikipedia.org/wiki/Thwaites_Glacier
- Global Warming: An Inconvenient History
https://www.youtube.com/watch?v=GGtAilkWTtI
 Back to Home
Neil Rieck
Waterloo, Ontario, Canada.